Research
Estimating population average treatment effects for food labelling policy: A causal inference modelling approach for generalising trial findings to target populations in non-nested designs.
Synthesis of empirical evidence
The collective evidence generated through this thesis demands a fundamental shift in how researchers and policymakers conceptualise the pathway from policy implementation to public health impact. Traditionally, front-of-package (FOP) labelling has been treated as a straightforward tool for informational disclosure, resting on the neoclassical assumption that providing consumers with comprehensive data will naturally lead to optimised dietary consumption.
However, by synthesising the findings from the empirical investigations conducted in this dissertation, a more complex and nuanced reality emerges. This thesis demonstrates that the limited effectiveness of current labelling policies is not a failure of consumer willpower, but rather a systemic oversight regarding the perceptual and cognitive constraints of human information processing.
Situated within this interdisciplinary landscape, this thesis investigates FOP labelling effectiveness by addressing both the empirical constraints of individual cognition and the methodological challenges of integrating data to estimate population-level impacts. The remainder of this thesis is structured across four subsequent chapters:
- Chapter 2: Theoretical and methodological background. This chapter outlines the theoretical and methodological background of the thesis. It details the potential outcomes framework, the structural assumptions required for causal transportability, and the use of doubly robust machine learning estimators to integrate data sources while minimizing model misspecification.
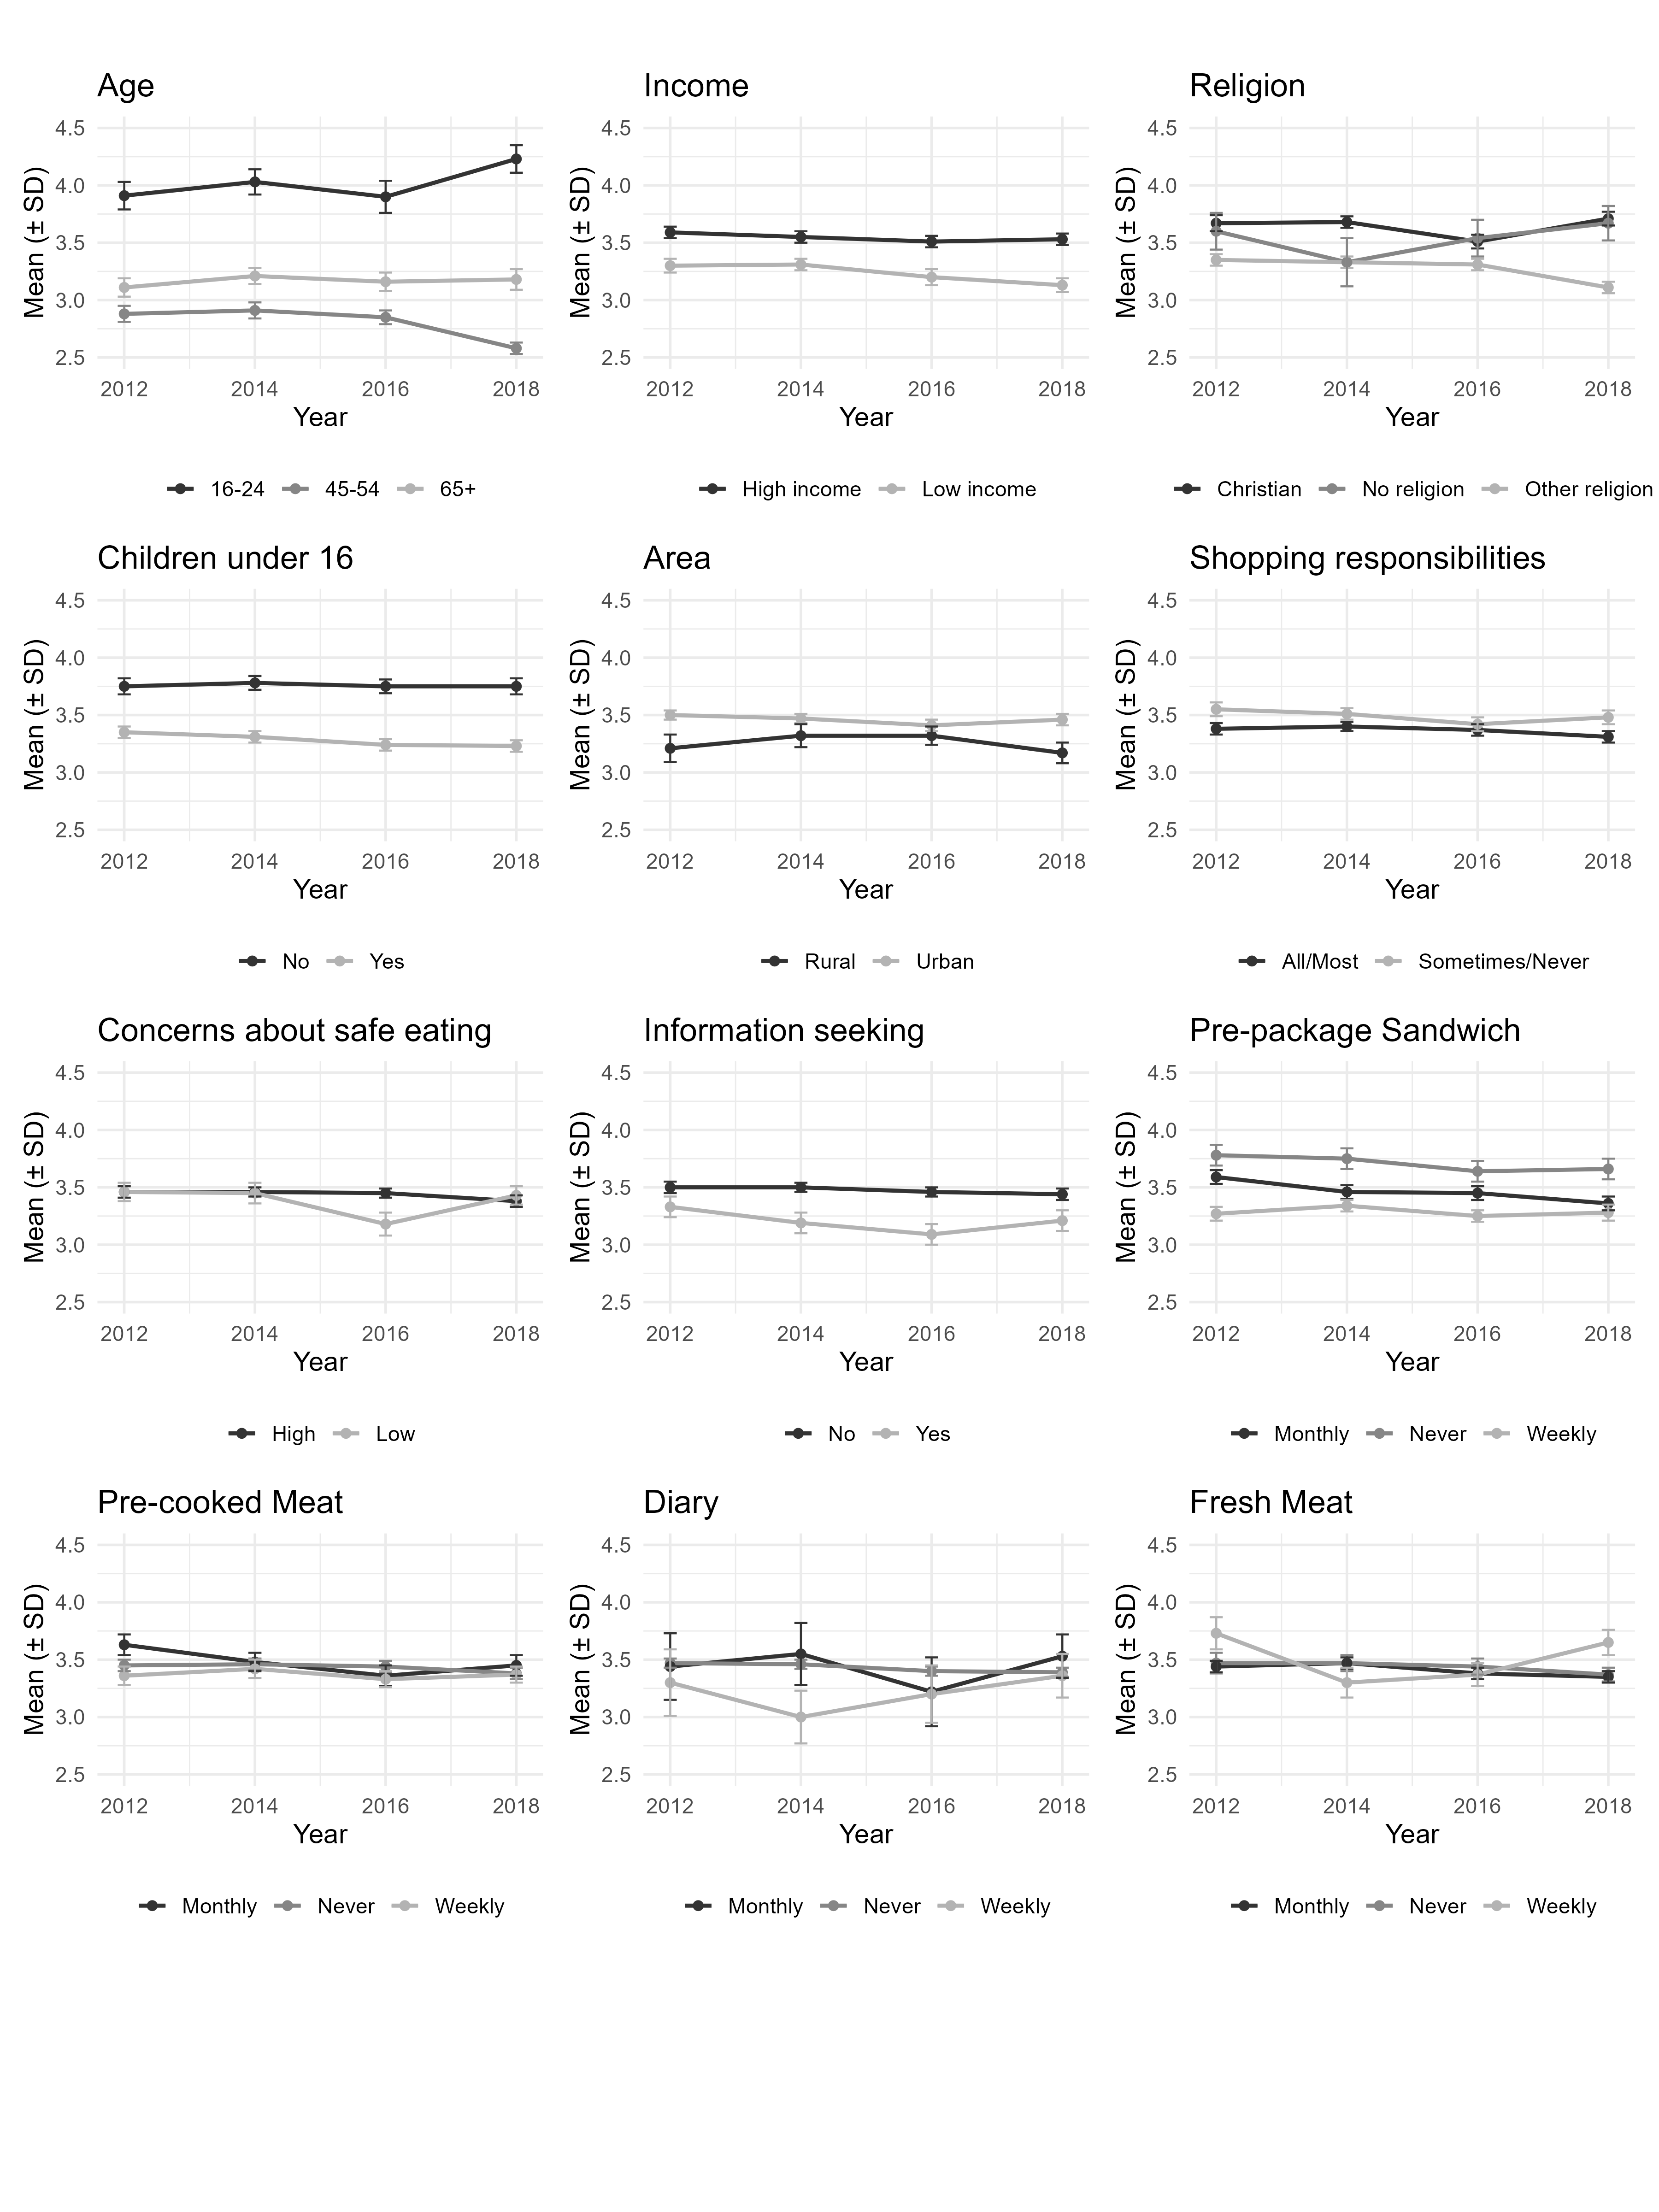
- Chapter 3: Food label readability and consumption frequency: isolating content-specific effects via a non-equivalent dependent variable design. Directly linking to the aim of investigating mechanisms of label salience, this chapter explores the salience-to-understanding pathway using observational data. Acknowledging the challenges of unmeasured confounding in nutritional epidemiology, it applies a quasi-experimental non-equivalent dependent variable design to repeated cross-sectional UK survey data. It investigates whether subjective perceptions of label print size readability block the effectiveness of nutritional warnings on ultra-processed ready-to-eat meals, isolating content-specific effects from general label presence. By highlighting that perceptual clarity is a critical bottleneck for less-engaged consumers, this chapter connects the physical limitations of label design to the behavioral realities of consumption.
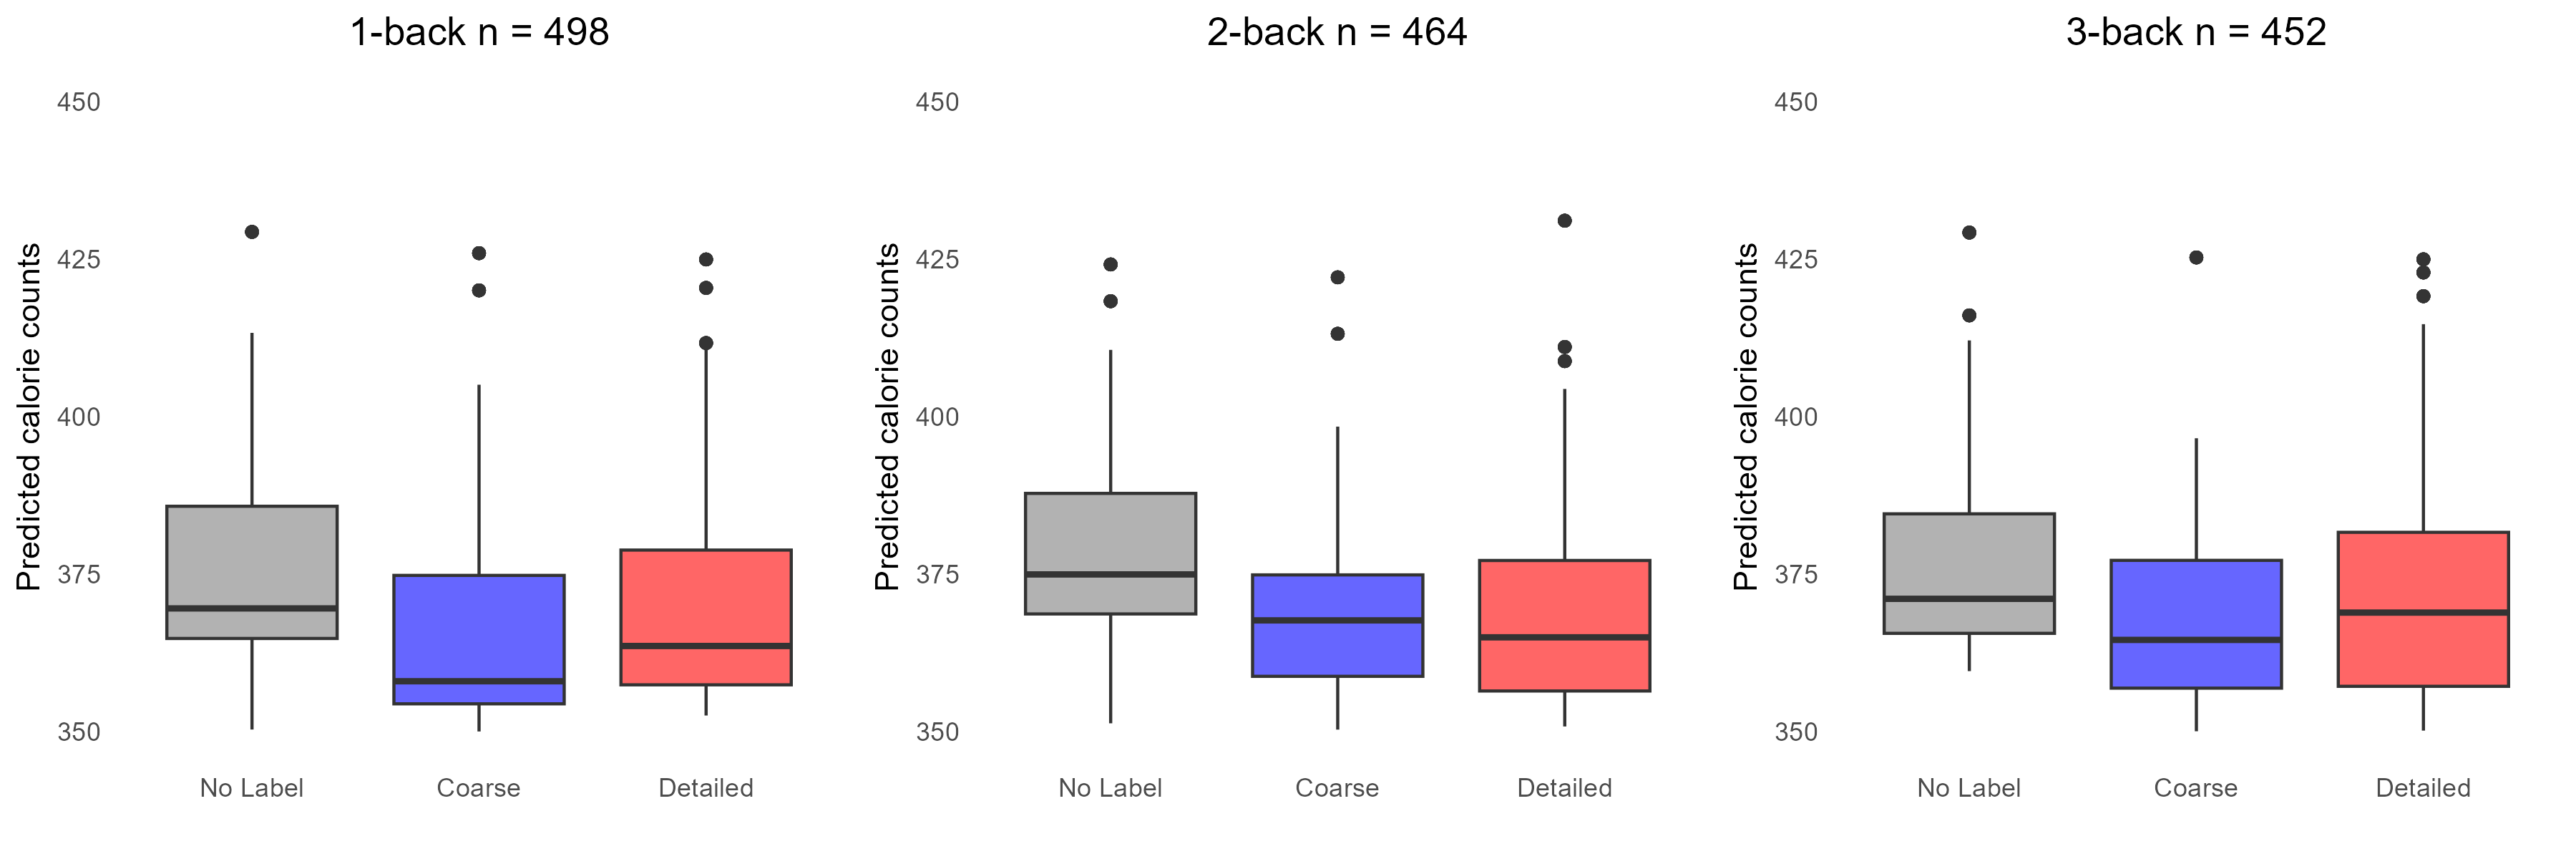
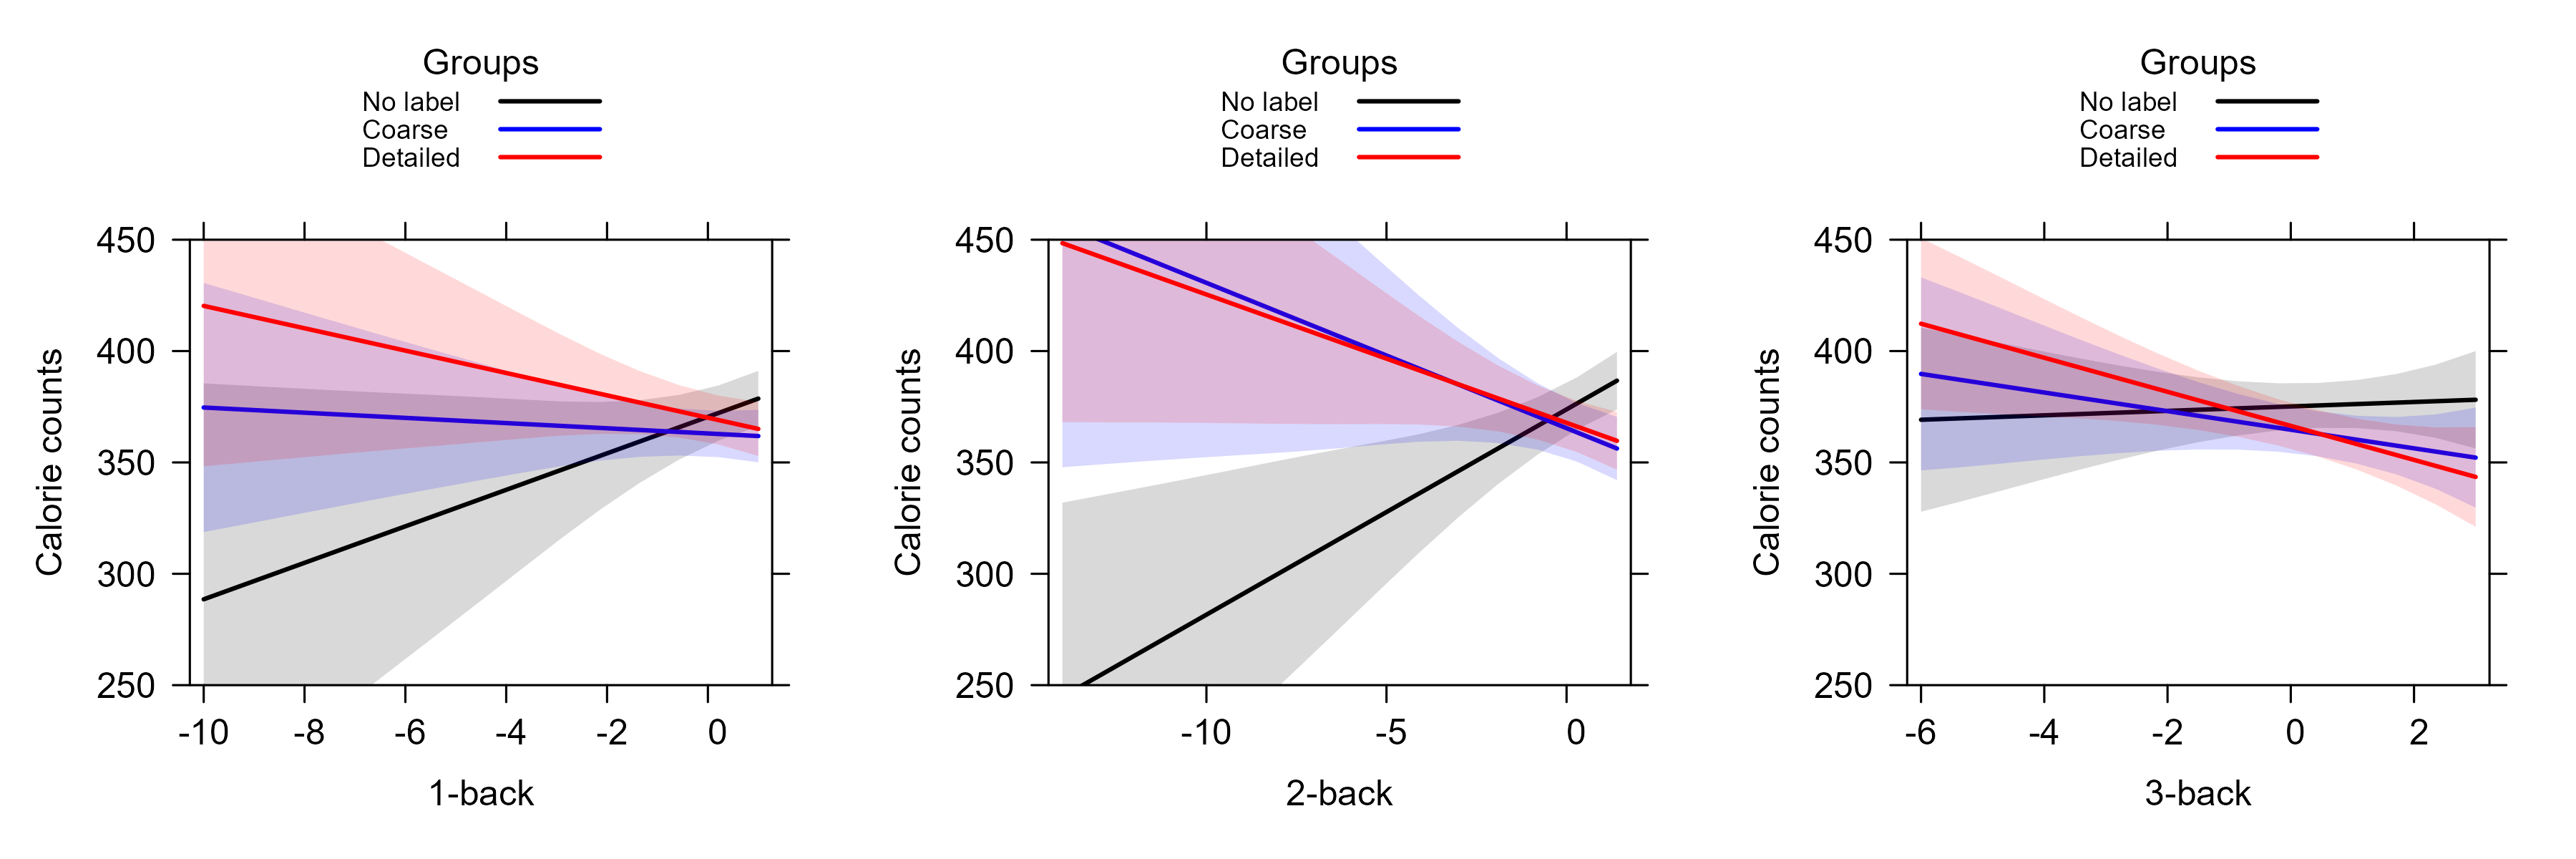
- Chapter 4: Food label granularity and working memory: effects on food choice in a randomized controlled trial. Building on the need to understand cognitive barriers to comprehension, this chapter utilizes an experimental trial to generate internally valid causal estimates regarding label design. Grounded in cognitive-load theory, it tests how label granularity interacts with individual cognitive constraints. The analysis examines whether the effectiveness of detailed versus coarse nutritional labels on calorie selection is actively modified by a consumer’s working memory capacity. While consumption decisions are ultimately driven by a multitude of cultural, environmental, and economic factors, this chapter specifically isolates the role of cognitive constraints and informational granularity to test the hypothesis that label effectiveness increases with available cognitive bandwidth.
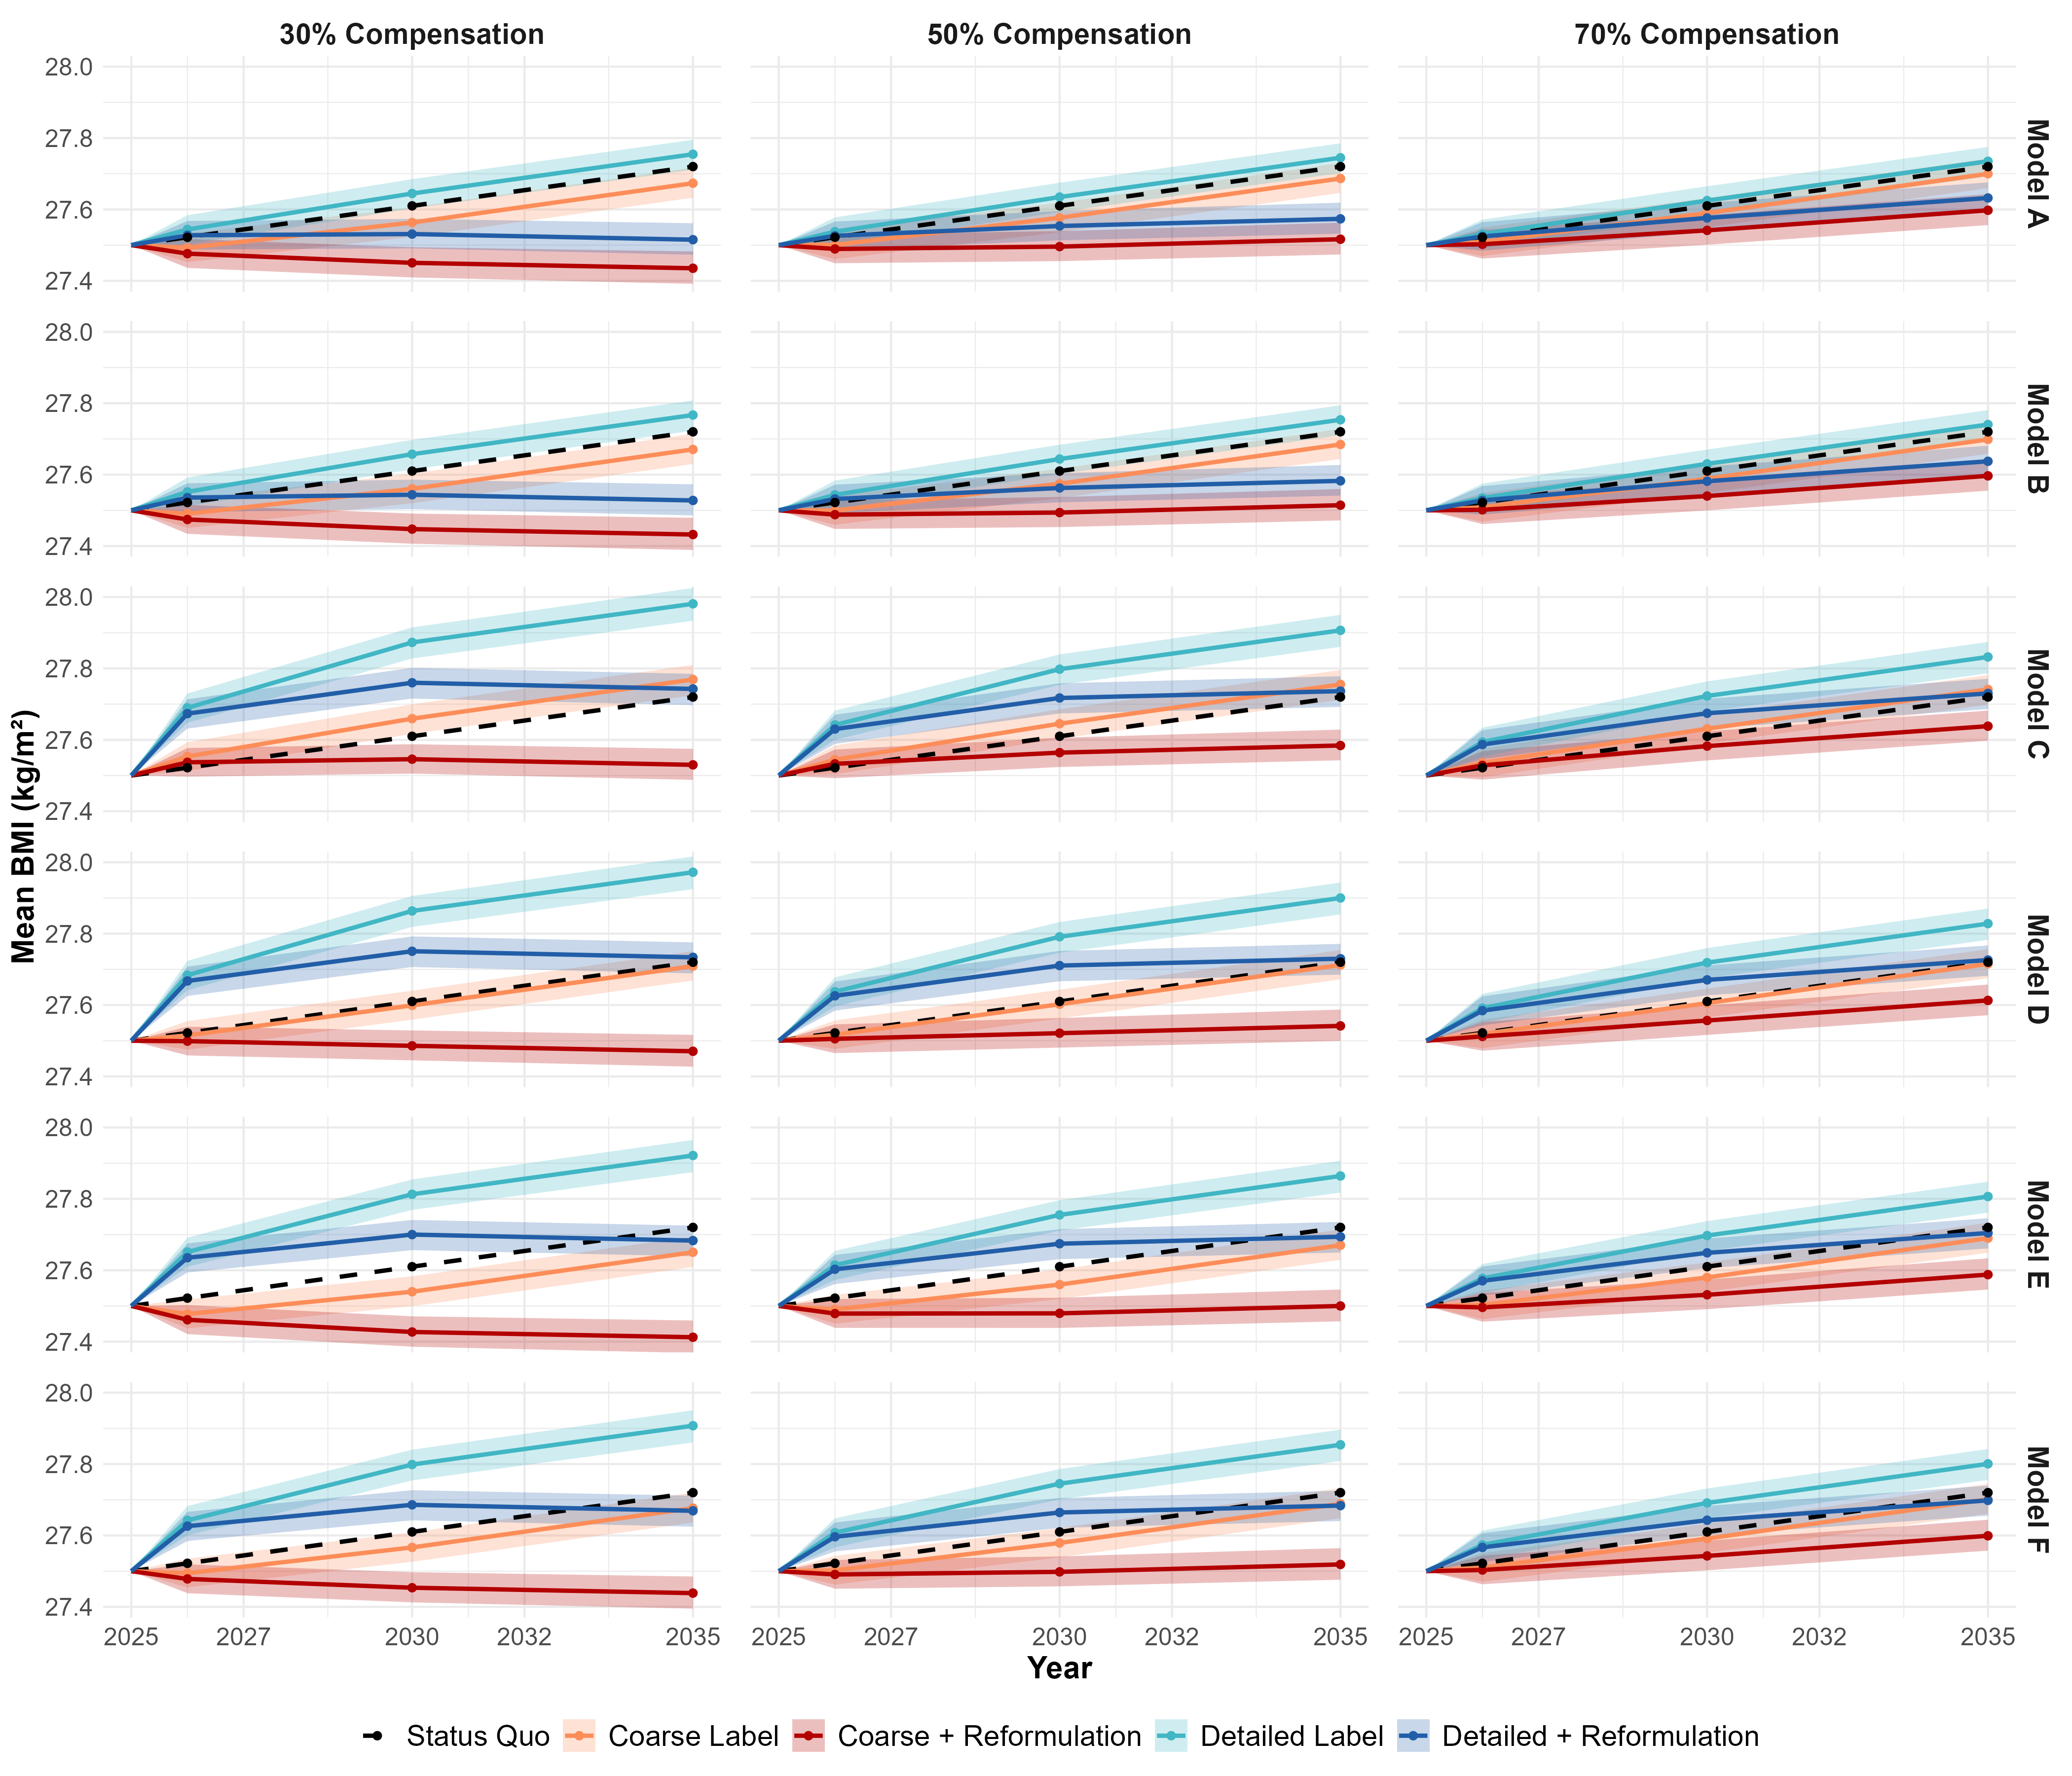
- Chapter 5: On the selection of covariates for transportability: a doubly robust BART approach for generalizing a food labeling trial and modeling long-term public health impact. Finally, addressing the aim of bridging the gap between experimental evidence and real-world impact, this chapter synthesizes the preceding analyses by applying transportability methods to a non-nested design. It integrates the experimental trial data from Chapter 4 with observational data from the UK National Diet and Nutrition Survey. Using doubly robust Bayesian additive regression trees (BART), this chapter transports the local trial behavioral effects to estimate the national population average treatment effect on consumption. Furthermore, it incorporates these estimates into a microsimulation to model longterm policy cost-effectiveness and utilizes sensitivity analyses to explicitly quantify the robustness of the estimates against potential omitted covariates.
Each of the empirical chapters (Chapters 3, 4, and 5) is structured as a self-contained research paper, complete with specific introductions, methodologies, and conclusions. While the chapters can be read independently, the prescribed sequence reflects the methodological progression of the thesis: diagnosing behavioral constraints via observational data, identifying causal mechanisms experimentally, and utilizing generalizability frameworks to forecast national public health impact.
Experimental Visuals & Policy Models